No Two Oil & Gas Databases Are Alike — And That’s the Industry’s Biggest Unsolved Problem
Why upstream data is so fragmented, what it actually looks like in the wild, and what it’ll take to fix it.
If you’ve spent any time working with oil and gas data, you already know the pain. Your drilling data lives in one system (or three). Your production accounting lives in another. Your land records, your regulatory filings, your decline curves, your revenue statements are all scattered across software platforms that were never designed to talk to each other.
It’s not just that different companies store data differently. Inside a single operator, the same well can look unrecognizable depending on which department’s software you’re pulling from. The drilling team’s WellView database, the production team’s accounting platform, the land team’s GIS system, and the revenue team’s check stubs all represent the same assets but with different identifiers, different field names, different structures, and sometimes different answers to the same question.
The oil and gas industry has been talking about data standardization for decades. We think the answer isn’t waiting for universal agreement. It’s building something useful enough that the standard emerges on its own.
McKinsey studied sensors across offshore rigs worldwide 1 and found that less than 1% of the data collected from roughly 30,000 data points per rig was actually being used in decision-making. Bain & Company estimated 2 that advanced analytics could improve production by 6 to 8%. And yet, according to McKinsey’s 2024 research 3, 70% of oil and gas companies remain stuck in the pilot phase of digital transformation, with an average digital maturity score of just 2.3 out of 5.0.
The culprit isn’t a lack of data, it’s that the data is trapped in systems that don’t connect. As SPE’s Journal of Petroleum Technology 4 put it, most companies think implementing a new ERP will solve the problem — and they’re “sorely mistaken when, after investing millions of dollars in a new accounting system, the data is still bad.”
Oil and gas data is, frankly, abysmal. The industry generates massive amounts of it and utilizes almost none. At Collide, a huge portion of our R&D has gone into processing and normalizing this data — the unsexy plumbing work that nobody wants to do but that everything else depends on. Here’s what that problem actually looks like, and why we think the path forward isn’t another top-down standard.
A Different System at Every Layer
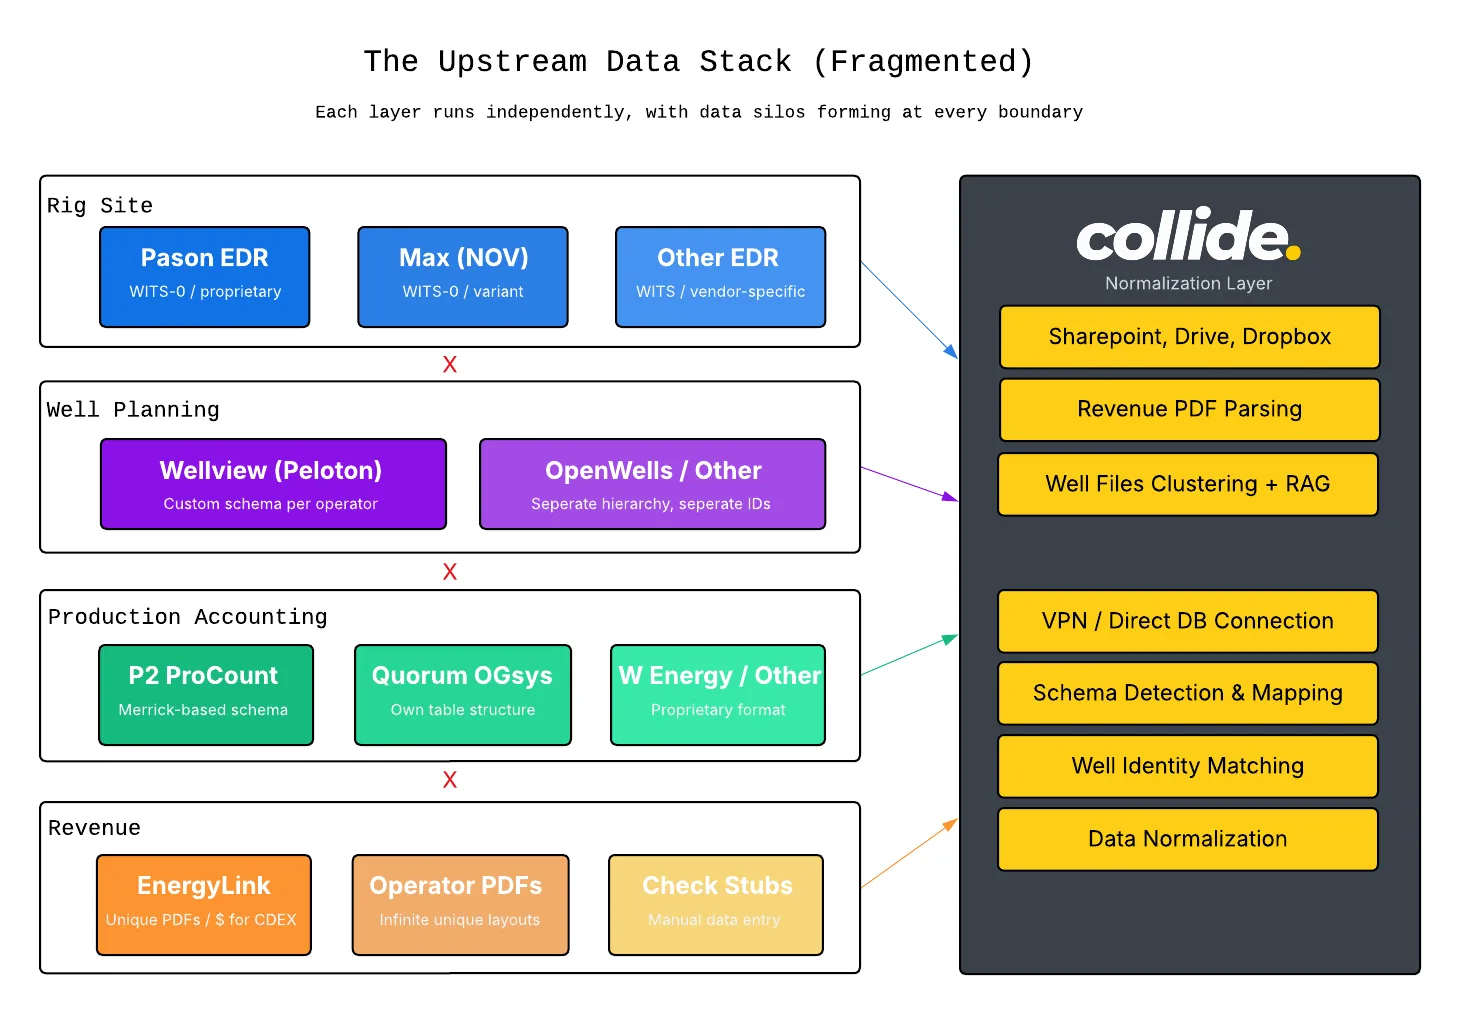
The modern upstream operator doesn’t run one software platform. They run a dozen, layered on top of each other over decades, each solving a specific problem but creating a new silo in the process.
At the rig site, you’ve got EDR providers — Pason, Totco (NOV), and others — recording drilling parameters in real time: hookload, WOB, ROP, torque. They all speak WITS (Wellsite Information Transfer Specification), which should make things simple. It doesn’t.
WITS-0 is about as bare-bones as a protocol gets: plain text key-value pairs sent over a simple connection. A bit depth reading looks like && / 01081000.00 / !! , an ID code, a value, done. It works 99% of the time and it’s easy to read and diagnose when something goes wrong. But nobody implements it quite the same way, and there are enough corner cases between vendors that you end up verifying the mapping rig by rig. One provider maps hookload average to the hookload max channel. Another assigns different ID codes to the same physical measurement. The bigger limitation is that WITS-0 is fire-and-forget. Once a value is sent, there’s no way to correct it. Surveys from your EDR are a good example: they get revised constantly for legitimate reasons, but the protocol has no mechanism to say “that last value changed, update it.” Same with downhole log data. Once it’s out the door, it’s out.
WITSML came along to fix this by adding real structure: a defined hierarchy for wells, wellbores, logs, surveys, etc. so data could be organized and updated, not just streamed. The early versions worked fine in concept, but the specification left a lot of common operations undefined, so vendors filled in the blanks differently. The result was that two systems both “speaking WITSML” could behave quite differently under the hood. The latest version, WITSML 2.0, introduced a modern real-time transport layer with persistent connections and change notifications, which is a genuine improvement. But the spec also grew substantially. The standards body included a lot of large international operators and service companies, and their requirements made the protocol significantly more complex to implement. That’s a real barrier for smaller companies. A large service company can dedicate a team to protocol support; a typical American MWD or directional shop often can’t justify that investment.
For well planning and operations, there’s WellView 5 (Peloton), the lifecycle database used by over 70% of the industry. It’s powerful, but it stores everything in its own schema, one that’s been evolving continuously since 1991. Drilling data management was added in ‘97, with geological and well integrity modules following over the years. Every operator configures it differently. Two companies running the exact same software end up with meaningfully different data structures because they’ve customized fields, workflows, and hierarchies to fit their operations.
At the production accounting layer, you’ve got P2 (ProCount), Quorum (OGsys), W Energy, Scout IFS, and plenty of proprietary systems each with its own approach to organizing well records, tracking volumes, and classifying status. Column names differ. Table structures differ. Even the concept of “well producing status” differs across platforms: Wyoming’s regulator uses codes like PO and SI, Ontario uses OP and GP-ABD, and Enverus maps each state’s taxonomy into its own unified system. Inside a single company, your production team, your accounting team, and your regulatory team can all be looking at the same well and seeing different status labels depending on which software they’re in.
At the revenue layer, check stubs and owner statements arrive in formats ranging from structured CDEX files to hundred-page PDFs with wildly inconsistent layouts.
And none of these systems were designed to integrate with each other. P2’s own blog 6 acknowledges the tension: evaluating a well for a workover requires production history, decline analysis, expenses, revenues, and ownership data — and “this data comes from many sources.” Managers “often spend much of their time finding, cleaning, and connecting it,” and when pulling from independent systems, “there are often differences that make it hard to line up.”
The Well Identity Crisis
The fragmentation isn’t just structural, it’s semantic. The same well gets a different identity in every system it touches.

Ask a regulator, a drilling engineer, and an accountant to identify a well, and you’ll get three different answers. The regulator might use an API number (not application programming interface, but American Petroleum Institute) and a state lease number. The engineer might use the well name with suffixes like H (horizontal) or A/B for completions. The accountant might use whatever internal ID their production accounting software assigned.
The API number is supposed to be the universal identifier, but even it isn’t consistent. As WellDatabase has documented 7, the API number (a 10-digit base identifier that extends to 12 or 14 digits with sidetrack and event codes) has been handled differently across states for decades. West Virginia historically dropped the state code and leading zeros from county codes. Kentucky’s numbers assigned by IHS don’t match those assigned by the state Division of Oil and Gas. Illinois, North Dakota, Colorado, Michigan, and Utah all have their own deviations. During the period from 1979 through 2013, data exchange became increasingly difficult because identifiers hadn’t been assigned consistently.
Below the API number, things get messier. Well numbers can be stored with dashes (16-6), without (1606), with spaces (16 6), or fully zero-padded (16-06). All four can mean the same well. Some systems keep the number and suffix together (SMITH 1H); others split them into separate fields. Some format names as "LAST, FIRST" while others use "FIRST LAST" or mash the lease name, number, and suffix into one string with inconsistent punctuation.
If you’ve ever tried to reconcile a regulatory filing against an internal production database, you’ve felt this. It’s not an edge case, it’s the default state of well data across the industry.
Revenue Statements: The Financial Layer of Chaos
Production data is just one dimension. On the financial side, the fragmentation is arguably worse, because money is on the line.
When operators distribute revenue to working interest and royalty owners, they send revenue statements: check stubs detailing volumes, prices, deductions (gathering, processing, transportation, severance taxes), and net payments by property and product. The industry has a standard for this: CDEX (Check Stub Data Exchange), sanctioned by the API under Publication 3805. Enverus’ EnergyLink platform has become the dominant processing hub, connecting over 400 operators and handling $150 billion in payments.
But most revenue statements still arrive as PDFs. The layouts vary operator to operator: different column orders, different terminology for the same deductions, different levels of line-item detail. Some are two pages; some are over a hundred. EnergyLink can process these into structured CDEX files that accounting teams actually need for their ERPs, but that service comes at significant cost. For many companies, especially smaller operators and mineral owners, the reality is that someone on the accounting team spends hours manually keying data from PDFs or the work is outsourced overseas.
The challenge isn’t that parsing technology doesn’t exist. It’s that no two operators structure their statements the same way, and even the same operator can change their layout between months.
Why Decades of Standards Work Haven’t Fixed This
The industry isn’t unaware of the problem. There are serious efforts: OSDU (Open Subsurface Data Universe) is building a unified cloud data architecture backed by major operators and cloud providers. PPDM (Professional Petroleum Data Management) maintains a comprehensive data model that’s been the de facto reference for well data. Energistics publishes WITSML, PRODML, and RESQML for drilling, production, and reservoir data exchange.
But adoption remains uneven. OSDU is gaining traction among supermajors, but most mid-size and small operators are still running the same systems they’ve had for years and aren’t in a position to rip and replace. WITSML has been around since the early 2000s, yet vendors still implement it with enough variation that practitioners call these “dialects.” WITSML 2.0 introduced a new WebSocket-based protocol (ETP) to fix real-time streaming, but that just creates another version to support alongside the widely deployed 1.4.1.
The fundamental issue is that these are all top-down standards. They define what data should look like. But the data that actually exists in production databases that have been running for 20 years, on rig EDRs configured by service companies, in revenue statement PDFs designed by individual operators reflects decades of organic growth, vendor lock-in, and workflows built around specific people and processes. You can’t standardize that with a schema diagram. You have to meet it where it is.
The problem isn’t that the industry lacks standards. It’s that legacy software has so much inertia that even good standards can’t gain enough adoption to matter for the vast majority of operators.
What We’re Building Toward
At Collide, this is exactly the problem we’ve been heads-down on. Not by asking operators to adopt another standard or rip out their existing systems, but by building a layer that normalizes data from whatever software is already in place: well-known platforms, boutique tools, proprietary databases, PDFs, all of it, into a consistent, queryable format for LLMs or other workflows.
The approach is bottom-up: connect to the data where it lives (even if that means 6 weeks working with IT on a VPN tunnel into on-prem servers), understand the schema as it actually exists (not as it theoretically should), and apply matching and normalization to reconcile the differences. When we bring in a new data source, most of the intelligence is reusable, it’s the connectivity and schema mapping that changes.
This is the work that doesn’t make for exciting demos. Normalizing well identifiers across three different naming conventions. Parsing revenue statement PDFs that change layout every quarter. Writing matching logic that handles zero-padded well numbers and suffix variations across platforms that were built 20 years apart. It’s unglamorous plumbing but it’s the foundation that everything else depends on. You can’t build intelligent automation, AI-powered workflows, or real-time analytics on top of data that’s fractured across a dozen incompatible systems. The prerequisite to doing anything smart with oil and gas data is making it accessible and consistent first.
We’re not claiming to have solved the industry’s data problem. It’s enormous, and OSDU and PPDM are doing critical work at the infrastructure level. But we believe the practical path to a data standard doesn’t start with getting everyone to agree on a universal schema. It starts with software that bridges the gap between how data is stored today and how it needs to be used regardless of which legacy systems are underneath.
And once you’ve done that normalization work and once you have clean, consistent data flowing through a single layer, something interesting starts to happen. The tools that sat on top of all those legacy systems start to become optional. We’re already seeing it: clients using our platform for revenue statement processing instead of paying for third-party CDEX conversion, or pulling up well-level production maps in Collide instead of spinning up a Spotfire instance. We didn’t set out to replace those tools. But when the data layer works, the visualization and workflow layer becomes a much simpler problem, and it turns out a lot of what operators are paying for today is really just the ability to get their own data into a usable shape.
The long-term vision is bigger than a normalization layer. If enough of the industry’s data flows through a common format — not because a standards body mandated it, but because it was the easiest path to actually using the data — then that format becomes the de facto standard. Not top-down. Bottom-up. Built by solving real problems for real operators, one messy database at a time.
The oil and gas industry has been talking about data standardization for decades. We think the answer isn’t waiting for universal agreement. It’s building something useful enough that the standard emerges on its own.
Footnotes
-
CNBC, “US Energy Industry Collects a Lot of Operational Data but Doesn’t Use It” — https://www.cnbc.com/2015/03/05/us-energy-industry-collects-a-lot-of-operational-data-but-doesnt-use-it.html ↩
-
Bain & Company, “Advanced Analytics in Upstream Oil and Gas” — https://www.bain.com/insights/advanced-analytics-in-upstream-oil-and-gas/ ↩
-
McKinsey & Company, “Oil and Gas Industry Insights” — https://www.mckinsey.com/industries/oil-and-gas/our-insights ↩
-
SPE Journal of Petroleum Technology, “Data Dilemma: Unraveling the Challenges and Downsides of Data in Oil and Gas” — https://jpt.spe.org/data-dilemma-unraveling-the-challenges-and-downsides-of-data-in-oil-and-gas ↩
-
Peloton WellView Product Page — https://www.peloton.com/products/well-data-lifecycle/wellview/advantages/ ↩
-
P2 Energy Solutions, “The Problem with Siloed Data in Oil and Gas Reporting” — https://www.p2energysolutions.com/blog/problem-siloed-data-oil-and-gas-reporting ↩
-
WellDatabase, “History of the API Number” — https://blog.welldatabase.com/blog/history-of-the-api-number ↩